
Discounted Cash Flow
Discounted Cash Flow Valuation
- Last updated
- Jul 23, 2026
- Relationships
- 6
Mental model
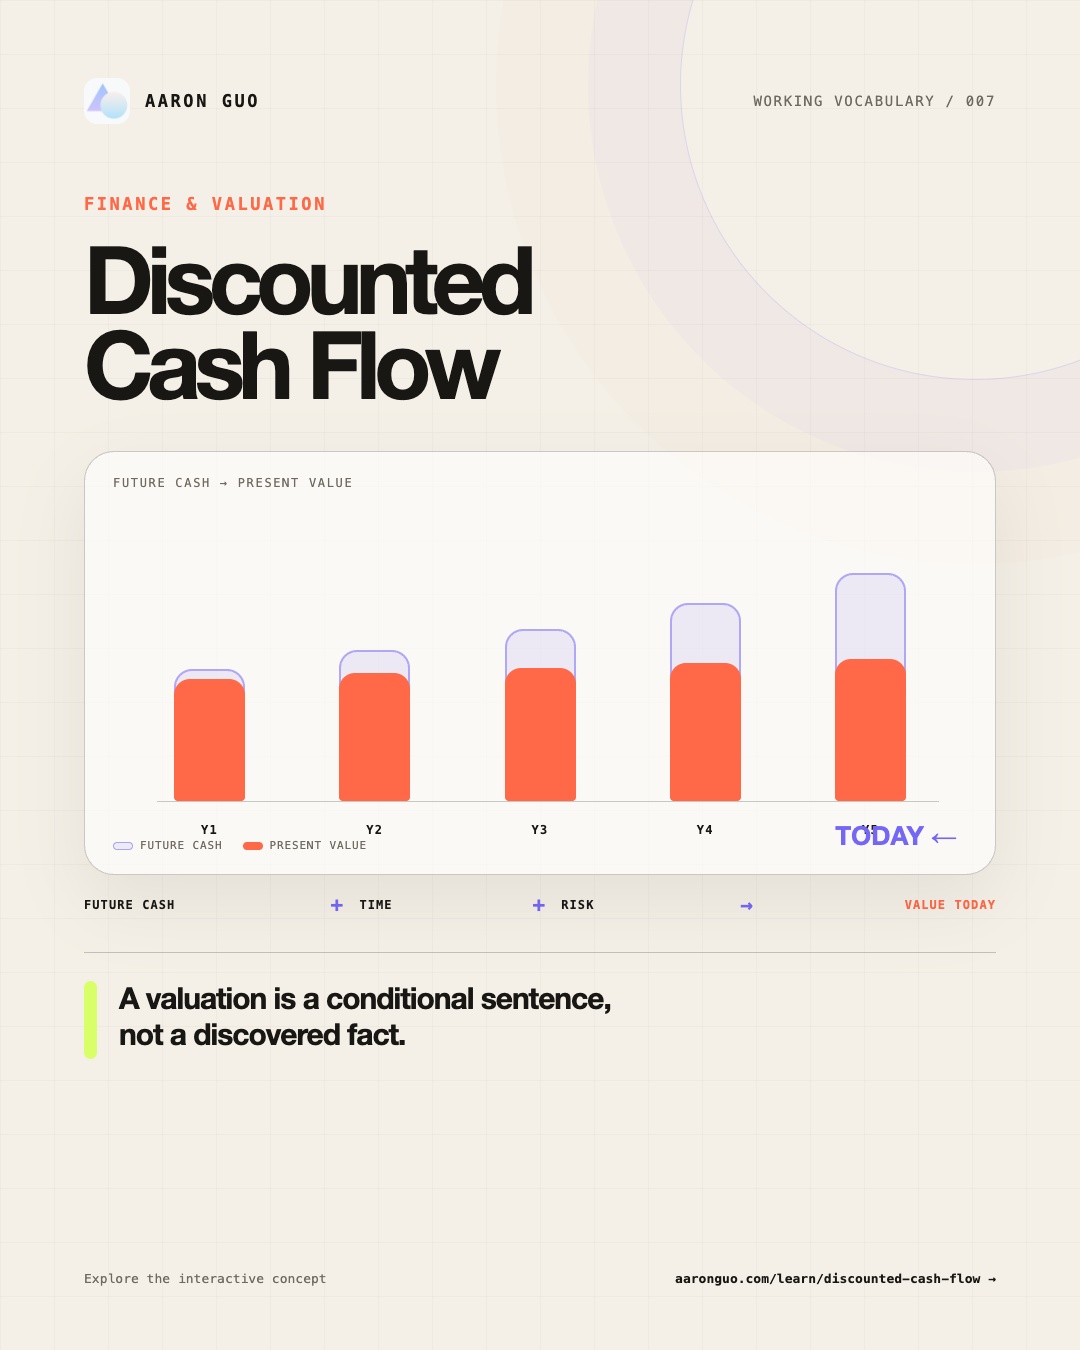
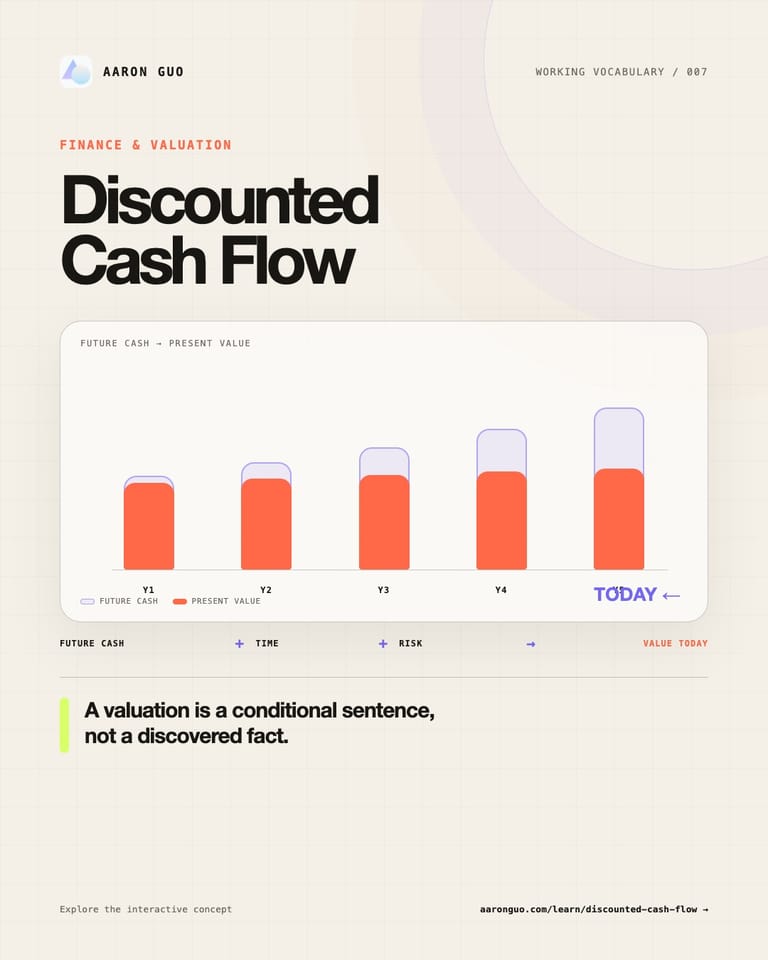
A DCF is a translator: future cash flow + time + risk → value today.
Visual memory card
The pattern, in one image.
A compact visual makes the pattern easier to recognize when it appears in a different example.
00 · Everyday example
You are considering buying one vending machine.
The seller asks $120,000. You begin with the cash the machine can actually leave after snacks, electricity, repairs, and location fees—not with its sales.
Cash it leaves
$8,000 / yearThis is the spendable cash left after operating costs—the everyday intuition behind free cash flow.
Write out five years
3% annual growthForecast the next five annual cash flows one by one. This is the explicit forecast period.
Price waiting and risk
10% required returnLater, uncertain cash is worth less today, so every future amount receives a discount.
Do not forecast forever
2% stable growthAll cash after year five is summarized in terminal value, then discounted back to today.
Under these visible assumptions, the simplified value after the remaining loan is about $101,400—not the $120,000 asking price.
This does not prove the seller is wrong. It identifies the gap that stronger cash flow, lower risk, or another reason must justify. The 10% personal required return is an intuition aid for the discount rate, not a formal WACC calculation.
01 · Valuation translator
Change an assumption. Watch the value sentence rewrite itself.
Every control enters the same Free Cash Flow to the Firm model. The chart, valuation bridge, and terminal-value share update together.
Future cash translated into present value
Each pale bar is a future cash flow. The solid bar inside it is what remains after discounting it to today.
Enterprise-to-equity bridge
76.8% Terminal shareMost value sits in the terminal period. Research the long-run growth, reinvestment, and return assumptions before refining decimals. Accurate reading: under the visible assumptions, the estimated equity value is $1.79b.
02 · Sensitivity
How discount rate and long-run growth change the answer
Rows change the discount rate (WACC); columns change stable growth. The outlined cell is the current model.
discount rate (WACC) → 7.5%8.3%9%9.8%10.5%2%$2.30b$2.02b$1.80b$1.62b$1.48b3%$2.73b$2.33b$2.04b$1.81b$1.62b4%$3.40b$2.79b$2.37b$2.06b$1.82b
03 · Reading discipline
The formula is useful because the assumptions stay visible.
Match the claim
This lab discounts Free Cash Flow to the Firm (FCFF) at the Weighted Average Cost of Capital (WACC), then subtracts net debt to reach equity value.
Growth is not free
A complete model must connect growth to margins, working capital, capital expenditure, and return on reinvestment.
Read a conditional sentence
The output is useful because the assumptions are visible and challengeable—not because the arithmetic is precise.
Educational, hypothetical illustration only. It does not value any real company or provide investment advice.
Discounted Cash Flow
Discounted Cash Flow (DCF) valuation asks a simple but demanding question: what are future distributable cash flows worth today, after accounting for when they arrive and the return required for bearing their risk?
The answer is not a hidden “correct price.” It is a conditional sentence:
If these operating, reinvestment, timing, and risk assumptions hold, the estimated value is approximately this amount.
That distinction is the heart of the method. A spreadsheet can calculate precisely while the assumptions remain deeply uncertain.
An everyday example: buying a vending machine
Suppose a vending machine in an office building is for sale at $120,000. You would not begin with snack sales. You would ask how much cash remains each year after restocking, electricity, repairs, and the location fee.
Start with a completely hypothetical set of assumptions:
- the machine currently leaves
$8,000of cash per year; - that cash grows by
3%annually for the next five years; - because you must wait and the machine could break, lose its location, or sell less than expected, you require a
10%annual return; - after year five, stop guessing year by year and assume cash grows at
2%in the long run; - the machine still has a
$5,000loan attached to it.
Discounting the first five annual cash flows back to today gives about $32,981. That is the present value of the explicit period. Summarizing all cash after year five into terminal value and discounting it back gives about $73,421. That is the present value of terminal value.
Present value of years 1–5   ≈  $32,981
Present value after year 5   ≈  $73,421
Operating asset value        ≈ $106,403
Less: remaining loan         =   $5,000
Buyer-equity value           ≈ $101,403
Under these assumptions, $101,403 is a conditional answer—not the machine’s “correct price.” If the seller still wants $120,000, DCF helps you ask what must explain the gap: more future cash, less risk, or another source of value.
The 10% required return is an everyday stand-in for the intuition of a discount rate. A formal Weighted Average Cost of Capital (WACC) for a company combines the required returns of debt and equity; it is not simply a number chosen by feel.
Four terms in plain language
- Free Cash Flow to the Firm (FCFF): cash the operating business can provide to lenders and shareholders together. Think of it as cash the business has produced before deciding which capital provider receives it.
- Weighted Average Cost of Capital (WACC): the combined annual return required by lenders and shareholders. In this model it is the discount rate used to translate future cash into today’s units; a higher WACC makes the same future cash worth less today.
- Present value of the explicit period: the sum of the next 5 or 10 years of cash flows after each year has been discounted back to today. “Explicit” only means those years are forecast one by one.
- Present value of terminal value: the model cannot forecast every year forever, so it summarizes all cash flows after the explicit period into one value at the forecast horizon, then discounts that value back to today.
Add the two present values to estimate Enterprise Value. Subtract Net Debt in this simplified model to estimate Equity Value.
First choose whose cash flow you are valuing
The first decision is not the growth rate. It is the capital claim.
- Free Cash Flow to the Firm (FCFF) belongs to debt and equity capital providers together. It is commonly discounted using the Weighted Average Cost of Capital (WACC) to estimate Enterprise Value.
- Free Cash Flow to Equity (FCFE) belongs only to common equity holders. It is discounted using the cost of equity to estimate Equity Value directly.
The cash-flow definition and discount rate must match. Discounting FCFF at the cost of equity, or FCFE at WACC, mixes up who receives the cash and who bears the risk.
The interactive model on this page uses FCFF, WACC, and a simplified net-debt bridge.
Build the explicit forecast
A common FCFF bridge begins with Earnings Before Interest and Taxes (EBIT):
FCFF
= EBIT × (1 − tax rate)
+ Depreciation & Amortization
− Capital Expenditure
− Change in Net Working Capital
The bridge exposes a constraint that optimistic stories often hide: growth is not free. More revenue may require inventory, receivables, equipment, research, distribution, or other reinvestment before it becomes distributable cash.
For each year t, discount the forecast cash flow:
Present Value of FCFFₜ = FCFFₜ / (1 + r)ᵗ
The rate r must use the same currency, inflation convention, time scale, and capital claim as the cash flow.
Account for cash flows beyond the forecast
A company does not disappear because a model stops after year five. DCF models therefore use a Terminal Value to summarize cash flows after the explicit period.
One common stable-growth form is:
Terminal Valueₙ = FCFFₙ₊₁ / (r − g)
Here g is the stable growth rate. The model requires r > g.
When g approaches r, the denominator approaches zero and Terminal Value explodes. That is not a discovery of enormous value. It is a warning that the long-run assumptions have lost economic discipline.
Discount the Terminal Value back to today and add it to the explicit-period cash flows:
Enterprise Value
= Σ Present Value of explicit FCFF
+ Present Value of Terminal Value
A simplified equity bridge is:
Equity Value = Enterprise Value − Net Debt
A complete bridge may also add non-operating cash and investments and subtract other non-equity claims. The interactive model uses only net debt so the mechanism stays visible.
A worked example
Suppose a fictional business starts with $100m of FCFF:
- five-year explicit forecast;
- 7% annual FCFF growth;
- 9% WACC;
- 3% stable growth;
$250mof net debt.
The present value of the five explicit cash flows is about $473m. The present value of Terminal Value is about $1,565m.
Enterprise Value ≈ $2,038m
Equity Value     ≈ $1,788m
Terminal share  ≈ 77%
That final line is often the most informative. A 77% terminal share does not automatically make the model wrong, but it says most of the answer is controlled by distant assumptions. The next research question should be about sustainable growth, reinvestment, competitive advantage, and the discount rate—not another decimal place.
What DCF is actually good at
Turning a story into a causal chain
“This is a great business” cannot enter a model directly. DCF forces the story into observable drivers:
market and competitive advantage
→ revenue growth and margins
→ reinvestment
→ free cash flow
→ risk and required return
→ value today
Locating disagreement
Two people may produce different values, but the disagreement usually lives in a small number of assumptions: how long growth lasts, what steady-state margins look like, how much reinvestment growth requires, and whether risk is consistently reflected.
DCF turns “I disagree with the price” into “I disagree with this operating or capital assumption.”
Comparing decisions without pretending to know the future
DCF can compare projects, acquisitions, capital-allocation choices, or operating scenarios under a common framework. Sensitivity analysis, scenario analysis, stress testing, and Monte Carlo simulation then challenge the conditional answer.
Where it works—and where it degrades
DCF tends to be most useful when:
- value mainly comes from future distributable cash flows;
- the operating model and reinvestment logic can be explained;
- cash flow and discount rate can be matched consistently; and
- the purpose is to understand value drivers, not merely reproduce a market multiple.
It becomes fragile when:
- an early-stage business has no credible path to normalized cash flow;
- a cyclical company is modeled from an abnormal peak or trough;
- debt is closer to operating raw material, as in many financial institutions;
- value comes largely from options to delay, expand, or abandon;
- Terminal Value dominates while steady-state economics remain unconstrained; or
- the model uses precision as decoration but does not test its critical inputs.
These cases do not always prohibit DCF. They often require a different model structure, cash-flow definition, or uncertainty treatment.
Common mistakes
“DCF is subjective, so it is useless”
Judgment is unavoidable, but judgment does not have to be hidden. A useful DCF makes assumptions visible, internally consistent, falsifiable, and easy to challenge. A market multiple contains assumptions too; they are simply less explicit.
“A higher discount rate is always more conservative”
Holding everything else constant, a higher discount rate lowers present value. But changing risk, inflation, growth, and cash-flow conventions inconsistently does not create conservatism. It creates a mismatched model.
“Terminal Value is the leftover bucket”
Terminal Value is often most of the valuation. It deserves operating constraints: What reinvestment supports stable growth? Does return on capital fade? Can the growth rate remain below the discount rate and fit the economy?
“A precise calculation is an accurate valuation”
The arithmetic can be exact while the assumptions are wrong. A responsible result is a range with visible drivers, not a fact disguised to two decimal places.
“Enterprise Value equals Equity Value”
FCFF discounted at WACC usually produces Enterprise Value. Only after bridging cash, debt, and other claims do you reach Equity Value.
Remember these five things
- Match the claim, cash flow, and discount rate: FCFF ↔ WACC; FCFE ↔ cost of equity.
- Growth consumes reinvestment before it becomes distributable cash.
- Terminal Value is often the main valuation, not an appendix.
- DCF outputs a conditional sentence, not an objective price.
- Use sensitivity, scenarios, stress tests, and simulation to challenge the result.
Self-test
- Why should FCFF not be discounted at the cost of equity?
- Why does value usually fall when WACC rises and all else stays constant?
- What happens as stable growth approaches the discount rate?
- Can revenue rise while FCFF falls? What reinvestment could cause that?
- If Terminal Value is 85% of Enterprise Value, which assumptions deserve the most scrutiny?
This page is an educational, hypothetical illustration. It does not provide investment advice or estimate the value of any real security or company.
Further reading
Relationships
Concept neighbors
Present Value
mathematical mechanismPresent Value
Converts one future amount into today’s units; DCF applies that mechanism to a complete cash-flow stream.
Free Cash Flow
core inputFree Cash Flow
Connects operating profit, taxes, reinvestment, and working capital to cash available to capital providers.
WACC
discount-rate inputWeighted Average Cost of Capital
Supplies a blended required return that matches free cash flow to the firm.
Terminal Value
long-horizon approximationTerminal Value
Compresses all cash flows after the explicit forecast period into one value at the horizon.
Sensitivity Analysis
diagnostic methodSensitivity Analysis
Shows which assumptions move the conditional valuation most.
Monte Carlo
uncertainty layerMonte Carlo Simulation
Runs the DCF value function across many coherent input sets to produce a conditional distribution.
Evidence trail